
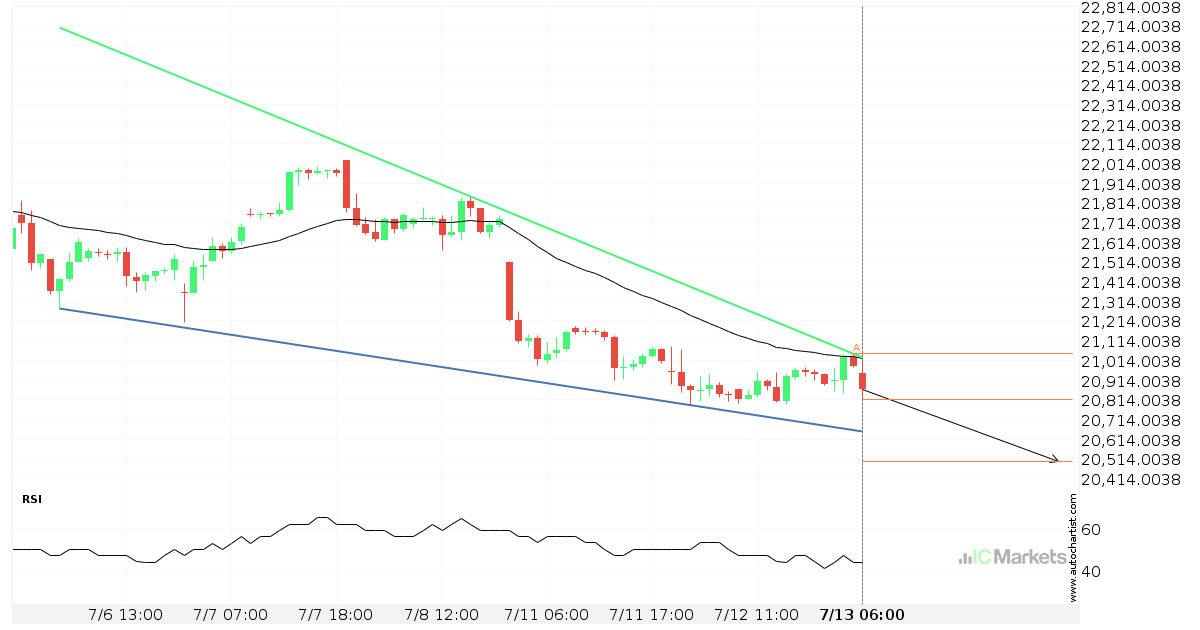
Either a rebound or a breakout imminent on Hong Kong 50 Index
Hong Kong 50 Index is heading towards the support line of a Falling Wedge. If this movement continues, the price of Hong Kong 50 Index could test 20501.1417 within the next 2 days. It has tested this line numerous times in the past, so this movement could be short-lived and end up rebounding just like […]
FTSE China A50 Index approaching support of a Channel Down
FTSE China A50 Index is approaching the support line of a Channel Down. It has touched this line numerous times in the last 5 days. If it tests this line again, it should do so in the next 10 hours.
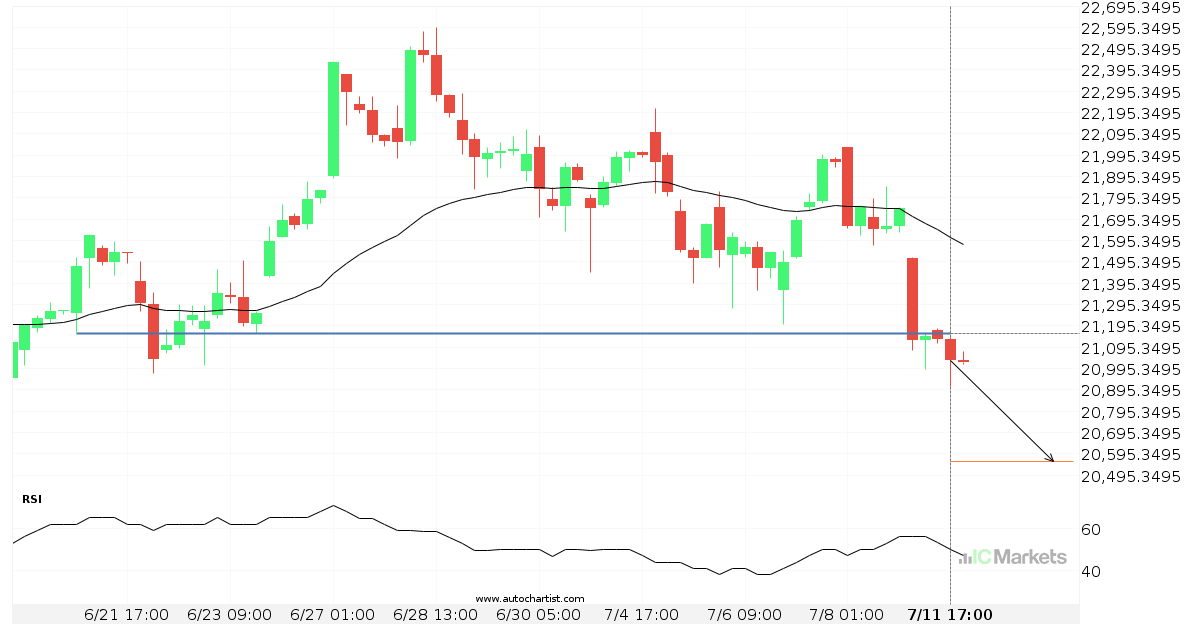
Important price line breached by Hong Kong 50 Index
Hong Kong 50 Index has broken through 21159.5000 which it has tested numerous times in the past. We have seen it retrace from this price in the past. If this new trend persists, Hong Kong 50 Index may be heading towards 20560.7109 within the next 3 days.
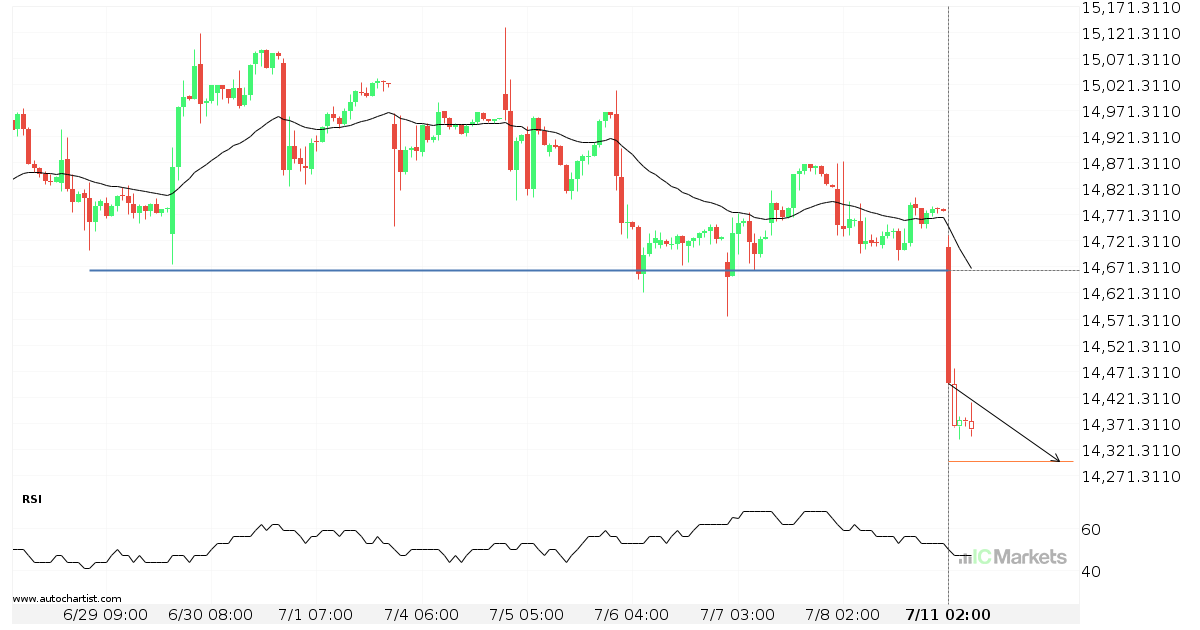
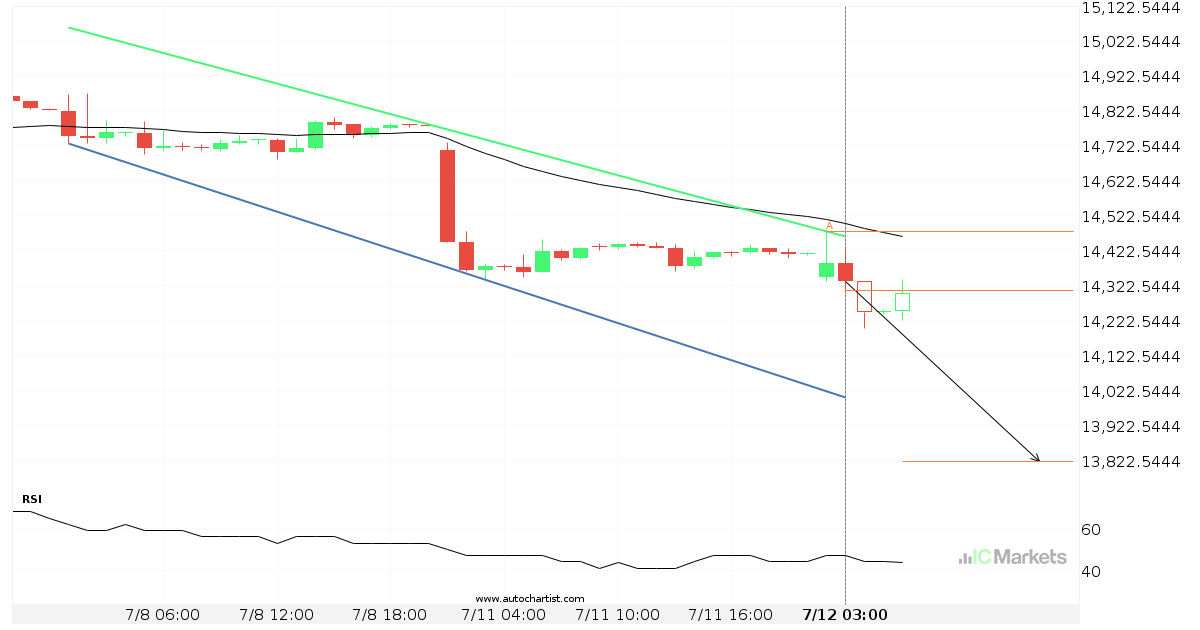
FTSE China A50 Index broke through important 14664.3096 price line
FTSE China A50 Index has broken through a support line. It has touched this line numerous times in the last 12 days. This breakout shows a potential move to 14298.7393 within the next 2 days. Because we have seen it retrace from this level in the past, one should wait for confirmation of the breakout.
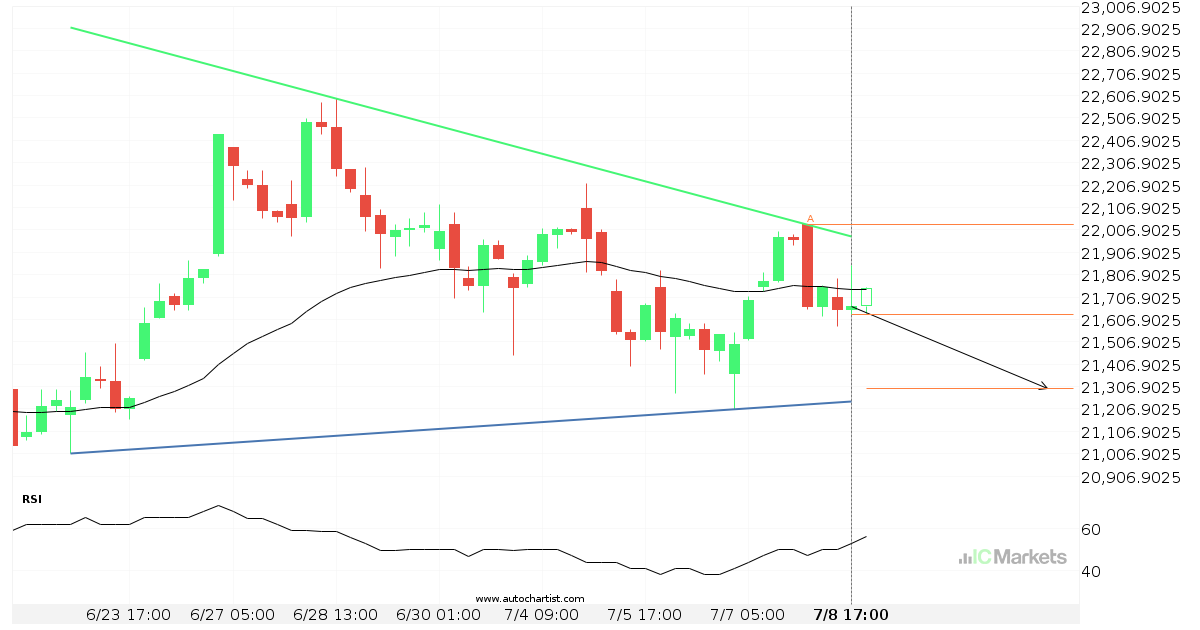
Hong Kong 50 Index approaching support of a Triangle
Hong Kong 50 Index is approaching the support line of a Triangle. It has touched this line numerous times in the last 16 days. If it tests this line again, it should do so in the next 3 days.

Hong Kong 50 Index approaching support of a Triangle
Hong Kong 50 Index is approaching the support line of a Triangle. It has touched this line numerous times in the last 16 days. If it tests this line again, it should do so in the next 3 days.
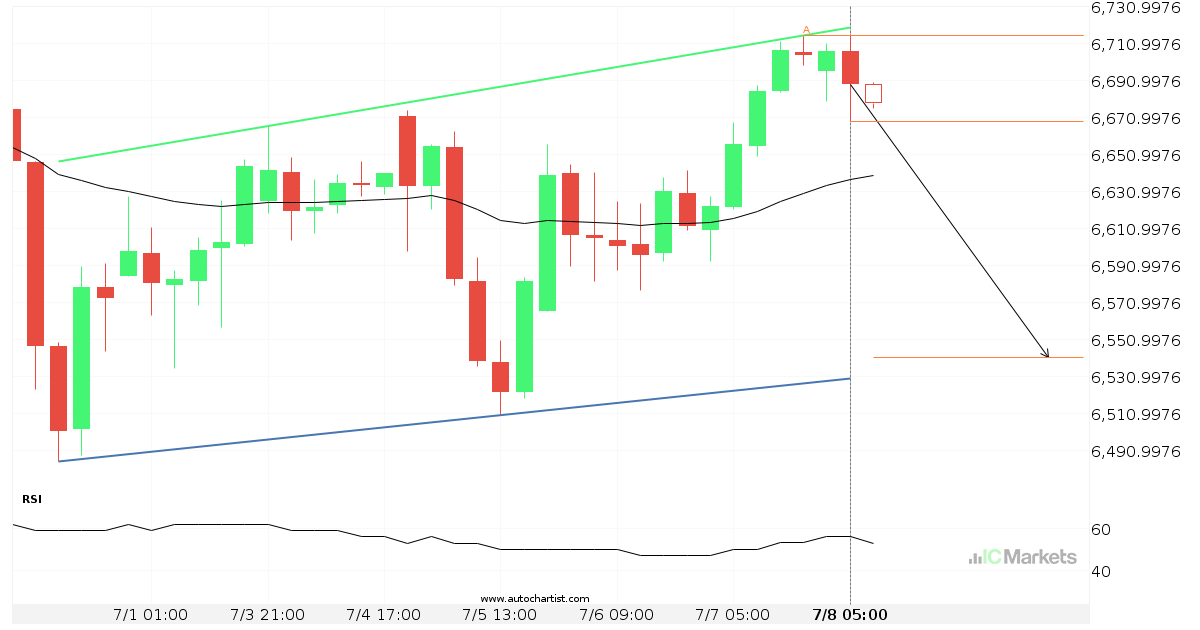
Either a rebound or a breakout imminent on Australia 200 Index
Australia 200 Index is heading towards the support line of a Channel Up. If this movement continues, the price of Australia 200 Index could test 6541.4076 within the next 2 days. It has tested this line numerous times in the past, so this movement could be short-lived and end up rebounding just like it did […]

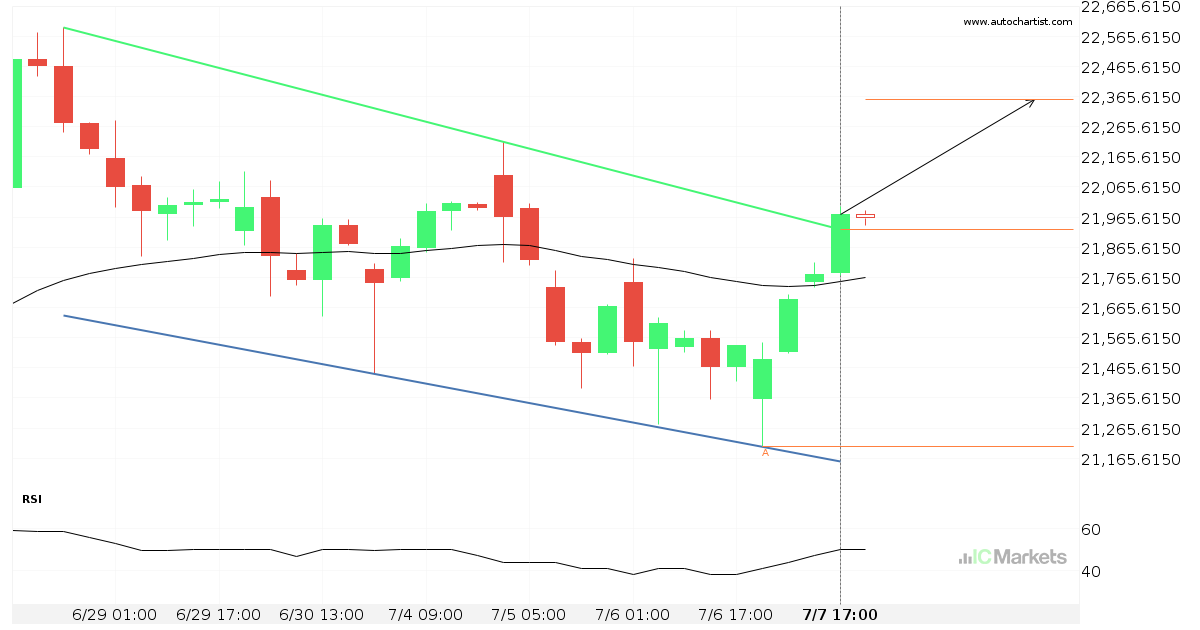
Hong Kong 50 Index has broken through resistance
Hong Kong 50 Index has broken through a resistance line. It has touched this line at least twice in the last 10 days. This breakout may indicate a potential move to 22354.9337 within the next 2 days. Because we have seen it retrace from this position in the past, one should wait for confirmation of […]